How to ship logs with Logstash, Elasticsearch and RabbitMQ
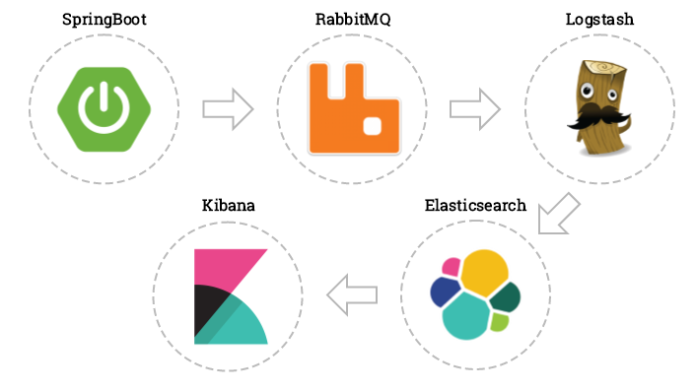
The architecture of our solution for shipping application logs to Logstash is visible in the picture below. We’ll start from sample Spring Boot application shipping logs to RabbitMQ exchange. Then using Docker, we’ll configure the environment containing RabbitMQ, Logstash, Elasticsearch, and Kibana – each running on separated Docker container.
My sample Java application is available on https://github.com/piomin/sample-amqp-logging.git.
There are only two Spring Boot dependencies needed inside pom.xml. First for REST controller and second for AMQP dependencies.
<dependencies>
   <dependency>
      <groupId>org.springframework.boot</groupId>
      <artifactId>spring-boot-starter-data-rest</artifactId>
   </dependency>
   <dependency>
      <groupId>org.springframework.boot</groupId>
      <artifactId>spring-boot-starter-amqp</artifactId>
   </dependency>
</dependencies>
Here’s a simple controller with one logging message.
import org.slf4j.Logger;
import org.slf4j.LoggerFactory;
import org.springframework.web.bind.annotation.PathVariable;
import org.springframework.web.bind.annotation.RequestMapping;
import org.springframework.web.bind.annotation.RestController;

@RestController
public class Controller {

   protected Logger logger = LoggerFactory.getLogger(Controller.class.getName());

   @RequestMapping("/hello/{param}")
   public String hello(@PathVariable("param") String param) {
      logger.info("Controller.hello(" + param + ")");
      return "Hello";
   }

}
I use logback as logger implementation and Spring AMQP appender for sending logs to RabbitMQ over AMQP protocol.
<appender name="AMQP" class="org.springframework.amqp.rabbit.logback.AmqpAppender">
   <layout>
      <pattern>
         {
            "time": "%date{ISO8601}",
            "thread": "%thread",
            "level": "%level",
            "class": "%logger{36}",
            "message": "%message"
         }
      </pattern>
   </layout>

   <!-- RabbitMQ connection -->
   <host>192.168.99.100</host>
   <port>30000</port>
   <username>guest</username>
   <password>guest</password>

   <applicationId>api-service-4</applicationId>
   <routingKeyPattern>api-service-4</routingKeyPattern>
   <declareExchange>true</declareExchange>
   <exchangeType>direct</exchangeType>
   <exchangeName>ex_logstash</exchangeName>

   <generateId>true</generateId>
   <charset>UTF-8</charset>
   <durable>true</durable>
   <deliveryMode>PERSISTENT</deliveryMode>
</appender>
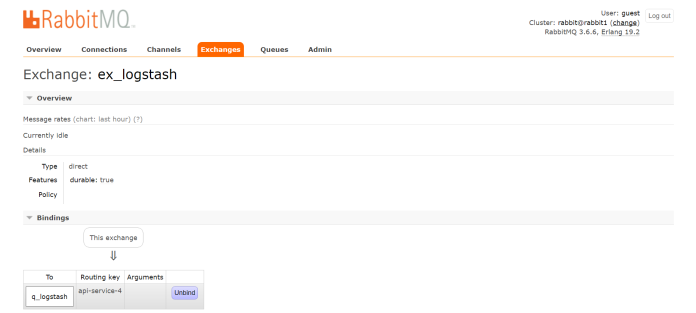
I run RabbitMQ server using docker image https://hub.docker.com/_/rabbitmq/. Here’s docker command for it. I choosed rabbitmq:management docker image to enable expose of RabbitMQ UI management console on port 30001. After running this command we can go to management console available on 192.168.99.100:30001. There we have to create queue named q_logstash and direct exchange named ex_logstach having routing set to q_logstash queue.
$ docker run -d -it --name rabbit --hostname rabbit -p 30000:5672 -p 30001:15672 rabbitmq:management
Then we run Elasticsearch and Kibana docker images. Kibana container need to be linked to elasticsearch.
$ docker run -d -it --name es -p 9200:9200 -p 9300:9300 elasticsearch
$ docker run -d -it --name kibana --link es:elasticsearch -p 5601:5601 kibana
Finally we can run Logstash docker image which get RabbitMQ queue as input and set Elasticsearch api as output. We have to change host to docker machine default address and port configured when running RabbitMQ container. Also we have durable queue so it has to be changed because default value for that is false following this reference:https://www.elastic.co/guide/en/logstash/current/plugins-inputs-rabbitmq.html
$ docker run -d -it --name logstash logstash -e 'input { rabbitmq {
host => "192.168.99.100" port => 30000 durable => true } }
output { elasticsearch { hosts => ["192.168.99.100"] } }'
After running all docker containers for RabbitMQ, Logstash, Elasticsearch and Kibana we can run our sample Spring Boot application and see logs on Kibana available on http://192.168.99.100:5601.


Related Posts