Spring Cloud Apps Memory Management

Today’s topic is about Spring Cloud memory usage as well as about microservices architecture. The inspiration to write this post was the situation when our available memory on test environment for the Spring Cloud based applications was exhausted. Without going into the details what was the cause of such a situation, the problem related with memory consumption by monolith based architecture in comparison with microservices is obvious. For example, supposing we have quite a large monolithic application, often 1GB or 2 GB of RAM will be enough for it, especially if we are talking about not a production environment. If we divide this application into 20 or 30 independent microservices it is hard to expect that the RAM will still remain around 1GB or 2GB. Especially if we use Spring Cloud 🙂
When running sample microservices I will use an earlier example prepared for the purpose of the one of previous articles, which is available on GitHub. I’m going to launch three microservices. First, for service discovery which uses Netflix Eureka server and two simple microservices which provide REST API, communicate with each other and register themselves in discovery server. I will not limit in any way the memory usage by those applications.
Like you see in the figure below those three running microservices have occupied about 1.5GB RAM memory on my computer. This is not the best message considering that we are dealing with very simple applications which do not even have a data persistence layer. The lowest RAM usage is for discovery service and the biggest for customer service which initializes declarative feign client for invoking account service API. Before making that screen I send some test requests to every microservice and run Eureka web console.

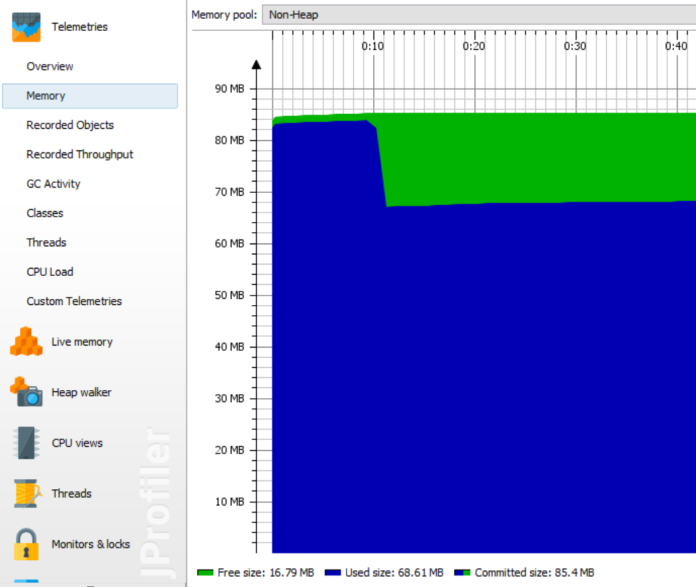
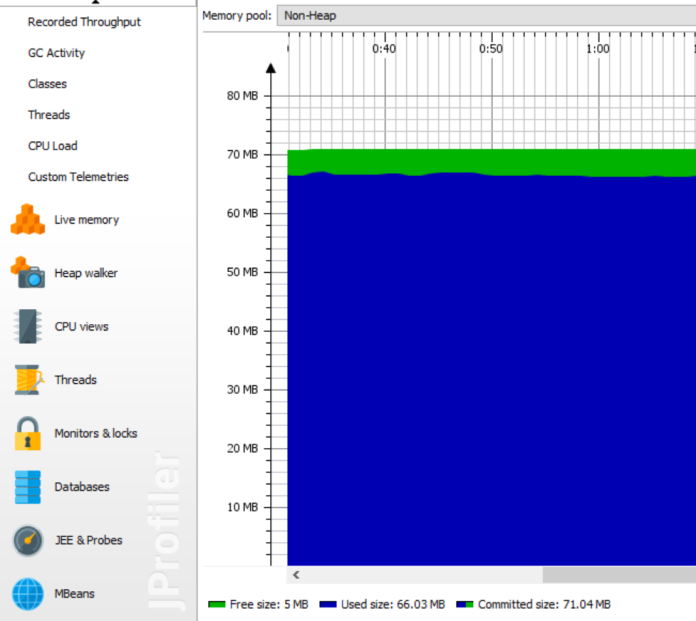
A lot about Spring Cloud memory usage is shown on the charts visible below made using JProfiler. As we see most of such a memory usage is affected by heap, in comparison to non-heap it does take up much space.
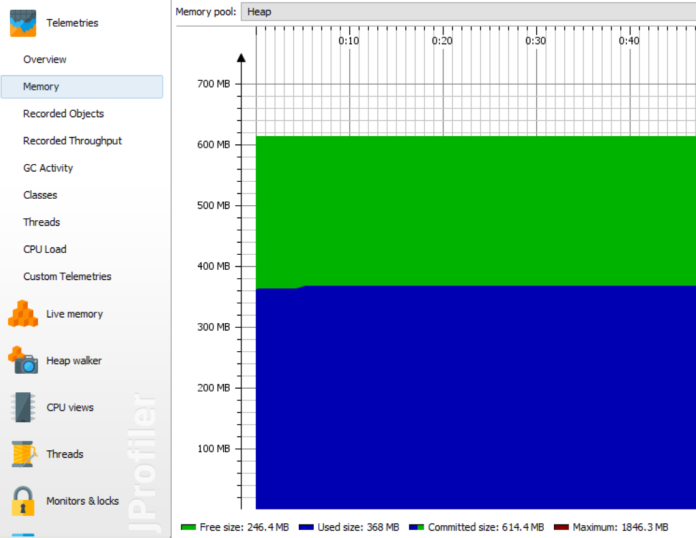
Of course, the first obvious question is whether we need as much space on the heap to run our microservice application. The answer is no, we do not. Now, let’s take a brief look at how the memory management process takes place in Java 8.
We can devide JVM memory into two different parts: Heap and Non-Heap. I have already mentioned a little about Heap. As you could see on the graphs above the heap commited size for our microservices was really big (~600MB). In turn, JVM Memory consists of Young Generation and Old Generation. All the newly created objects are located in the Young Generation. When young generation is filled, garbage collection (Minor GC) is performed. To be more precise, those objects are located in the part of Young Generation which is called Eden Space. Minor GC moves all still used objects from Eden Space into Survivor 0. The same process is performed for Survivor 0 and Survivor 1 spaces. All objects that survived many cycles of GC, are moved to the Old Generation memory space. For removing objects from there is Major GC process is responsible. So, these are the most important information about Java Heap. In order to better understand the figure below. The memory limits for Java Heap can be set with the following parameters during running java -jar command:
- -Xms – initial heap size when JVM starts
- -Xmx – maximum heap size
- -Xmn – size of the Young Generation, rest of the space goes for Old Generation
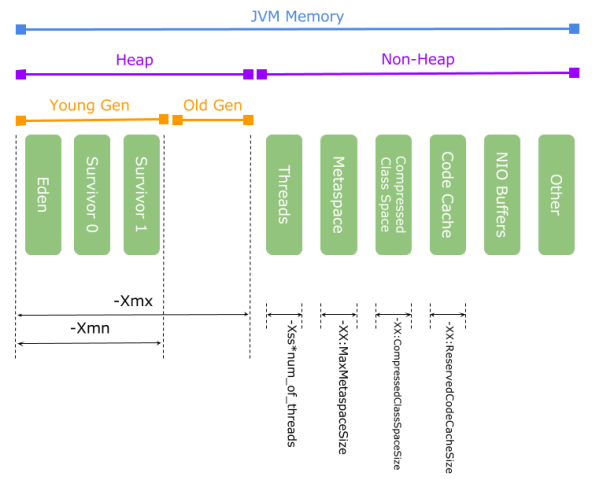
The second part of the JVM Memory, looking at the graphs above slightly less important from our point of view, is Non-Heap. Non-Heap consists of the following parts:
- Thread Stacks – space for all running threads. The maximum thread size can be set using -Xss parameter.
- Metaspace – it replaced PermGem, which was in Java 7 the part of JVM Heap. In Metaspace there are located all classes and methods load by application. Looking at the number of libraries included for Spring Cloud we won’t save much memory here. Metaspace size can be managed by setting -XX:MetaspaceSize and -XX:MaxMetaspaceSize parameters.
- Code Cache – this is the space for native code (like JNI) or Java methods that are compiled into native code by JIT (just-in-time) compiler. The maximum size is determined by setting -XX:ReservedCodeCacheSize parameter.
- Compressed Class Space – the maximum memory reserved for compressed class space is set with -XX:CompressedClassSpaceSize
- Direct NIO Buffers
To put it more simply, Heap is for objects and Non-Heap is for classes. As you can imagine we can end up with the situation when non-heap is larger than heap for our application. First, let’s run our service discovery with the parameters below. In my opinion these are the lowest values if you are starting Eureka with embedded Tomcat on Spring Boot.
-Xms16m -Xmx32m
-XX:MaxMetaspaceSize=48m
-XX:CompressedClassSpaceSize=8m
-Xss256k -Xmn8m
-XX:InitialCodeCacheSize=4m
-XX:ReservedCodeCacheSize=8m
-XX:MaxDirectMemorySize=16m
If we are running microservice with REST API and Eureka, Feign and Ribbon clients we need to increase values a little.
-Xms16m -Xmx48m
-XX:MaxMetaspaceSize=64m
-XX:CompressedClassSpaceSize=8m
-Xss256k -Xmn8m
-XX:InitialCodeCacheSize=4m
-XX:ReservedCodeCacheSize=8m
-XX:MaxDirectMemorySize=16m
Here are charts from JProfiler for the settings above and Customer service. The difference is in starting and requests processing time. The application is working slower in comparison with earlier settings (or rather lack of them :)). Well, I wouldn’t set such a parameters in production mode. Treat them rather as a minimum requirements for service discovery and microservice apps.
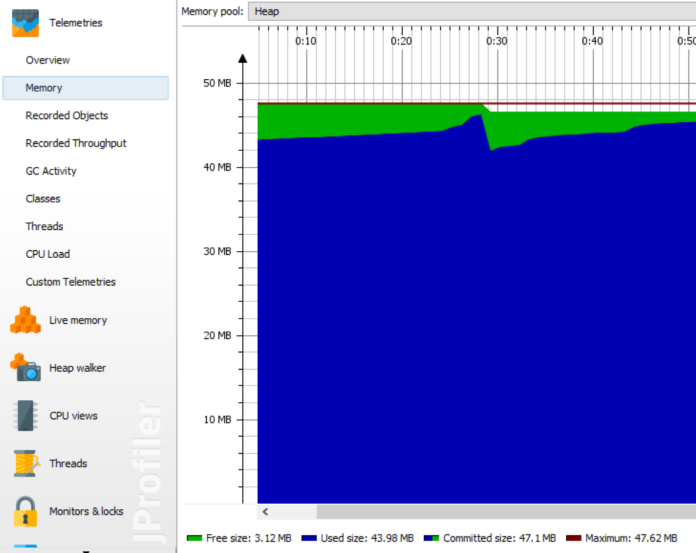
The current total Spring Cloud memory usage is as follows. It is still the biggest for Customer service and the lowest for Discovery.

I have also tried to run Discovery application using different web containers. You can easily change web container by including in your pom.xml file the dependencies visible below.
For Jetty.
<dependency>
   <groupId>org.springframework.boot</groupId>
   <artifactId>spring-boot-starter-jetty</artifactId>
</dependency>
For Undertow.
<dependency>
   <groupId>org.springframework.boot</groupId>
   <artifactId>spring-boot-starter-undertow</artifactId>
</dependency>
The best result was for Undertow (116MB), second place for Tomcat (122MB) and third for Jetty (128MB). This tests were performed only for Eureka server without registering there any microservices.


Related Posts