Using logstash-logging-spring-boot-starter for logging with Spring Boot and Logstash

I have already described some implementation details related to my library Spring Boot Logging Logstash starter for HTTP request/response logging in one of the previous articles Logging with Spring Boot and Elastic Stack. The article has been published some weeks ago, and since that time some important features have been added to this library. Today I’m going to summarise all those changes and describe all the features provided by the library.
First, let’s begin from a brief review of main features provided by the Spring Boot Logging Logstash starter:
- it is able to log all incoming HTTP requests and outgoing HTTP responses with full body, and send those logs to Logstash with the proper tags
- calculate and store an execution time for each request
- it generates and propagates correlationId for downstream services calling with Spring
RestTemplateor OpenFeign - it is auto-configurable Spring Boot library – you don’t have to do anything more than including it as a dependency to your application to make it work
1. Dependency
The first major change is that the library has been published on Maven Central and now you may use it in your application by including the following dependency to you pom.xml. The current version of library is 1.2.2.RELEASE.
<dependency>
  <groupId>com.github.piomin</groupId>
  <artifactId>logstash-logging-spring-boot-starter</artifactId>
  <version>1.2.2.RELEASE</version>
</dependency>
2. Enable Spring Boot logging
By default the library is enabled, but tries to locate Logback configuration inside your application to settings for Logstash appender. If such appender won’t be found, the library uses Spring Boot default logging configuration, which does not include Logstash appender. To force it use auto-configured appender definition inside library we have to set property logging.logstash.enabled to true. After setting the property the logs would be send to auto-configured default address of Logstash, which is localhost:5000. To override we have to use property logging.logstash.url. Generally, all the names of properties has been changed from spring.logging.* to logstash.logging.*, to meet the requirements for third-party libraries defined by Spring Boot team.
logging.logstash:
  enabled: true
  url: 192.168.99.100:5000
3. Secure connection with Logstash
We can enable secure connection on the client site by providing trust store location. To do that we should define property logstash.logging.trustStoreLocation, and if required password to the keystore in property logstash.logging.trustStorePassword.
logging.logstash:
  trustStoreLocation: /tmp/location/sample.jks
  trustStorePassword: 123456
4. Filtering the logs
By default all HTTP incoming request are intercepted and log by the library. We can customize this behavior and filter some unnecessary calls by declaring matching pattern. The sample configuration is visible below. The following pattern will filter all the requests starting with actuator (to exclude healthcheck calls), webjars.
logging:
  logstash:
    ignorePatterns: /(actuator|swagger|webjars).*
5. Logging HTTP headers
By default HTTP request and response headers are not logged. To enable it we have to set property logging.logstash.logHeaders to true. After that change log message will include section ‘headers’ with key/value map with all HTTP headers.
6. Fields exported to Logstash
If you decided to set property logging.logstash.enabled to true the library is sending all the MDC fields to Logstash. If you provide your own Logback configuration file you should configure Logstash appender to send all fields in mdc tag or define the list of fields to send. Here’s the list of supported fields logged by the library:
- X-Correlation-ID: correlates all the requests send to downstream services within a single call of endpoint
- X-Request-ID: id generated for a single pair request/response
- X-Response-Time: the time of request processing in milliseconds
- X-Response-Status: the HTTP status of response
- X-Operation-Name: the name of operation including controller name and method name
- audit: used for marking logs generated by the library
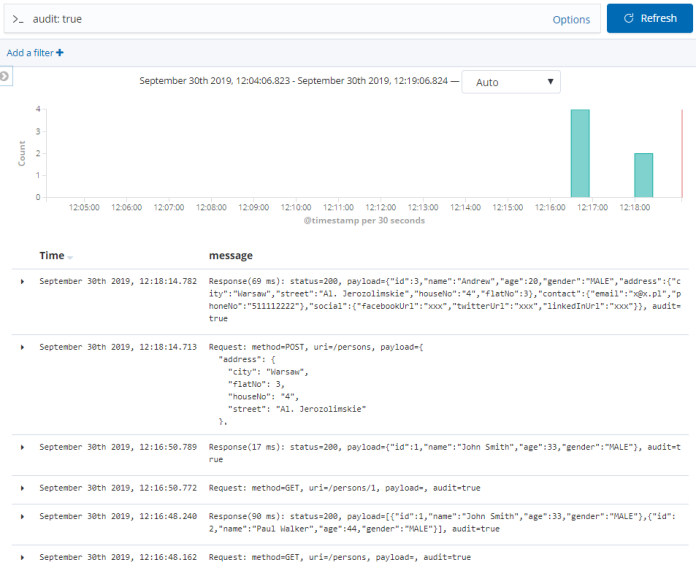
You can easily filter all the logs generated by the library using audit field as shown below.
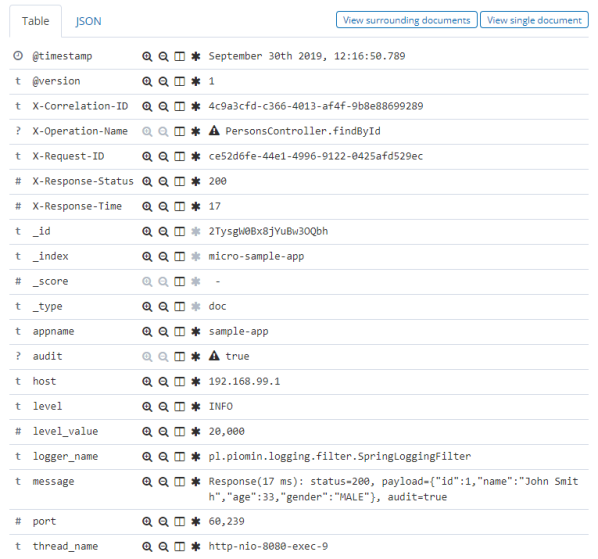
Here’s the screen showing all the fields sent by the library for a single record.
Summary
The source code repository with logstash-logging-spring-boot-starter is available on GitHub. You can check it out here: https://github.com/piomin/spring-boot-logging.git. You can report the bugs or propose new enhancements here: https://github.com/piomin/spring-boot-logging/issues. Any feedback would be very welcome. Enjoy 🙂


Related Posts